


If you work in power trading, you have probably heard about FERC Order 825. Implemented in June of 2016, this rule requires RTOs to align settlement and dispatch in three areas:
- Real-Time Energy
- Real-Time Operating Reserves
- Real-Time Transactions
In effect, this means that any ISO not already settling at 5-minute granularity will need to change, with the exception of CAISO and NYISO, which were already in compliance. All other ISOs are in the process of making changes to accommodate the new rules.
Front-Office Impact
For market participants, this change has tremendous implications for back-office systems. But what does it mean to the trader and portfolio manager responsible for bids and offers? With more granular settlement intervals, units with greater ramping flexibility or shorter startup times get an automatic bump in value. Perhaps your portfolio isn’t as “fast and furious” as you’d like, but with some investment to boost performance, you believe your fleet can improve returns.
Key Question: What methodology should you use to quantify value for upgrading assets to achieve greater operating flexibility, like ramp rates and startup characteristics?
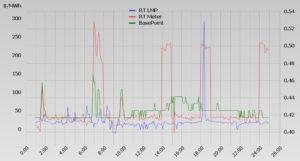
Today, many trading floors simulate day ahead (DA) operations for their generating assets in RTO markets. They do this for a variety of reasons, including fuel burn estimates, bid strategy formulation, and LTSA optimization. Most forecasting is done in hourly buckets because that’s really the limit of reality when it comes to price forecasting. However, to model the benefits of fast ramping, you need to simulate not just day-ahead hourly operations but a full two-market operation, with real-time dispatching at 5-minute intervals.
Looking Back
Setting up such a study can be a bit overwhelming unless you have the right tools and a defensible approach to the price forecasts. Using advanced power trading software can simplify this process. Here’s a suggestion: rather than trying to forecast 5-minute prices (which would be hard to defend), use historical prices. Back-casting a range of dates will provide some insight into how flexibility would have benefitted your wallet (in the past) as a reasonable estimate for the future. In this type of study, absolute prices are not as important as maintaining a realistic relationship between DA and RT price volatility. Here, historical prices are the best indicator because the DA/RT relationship correlates strongly and is very reliable.
Here’s an approach that PCI has successfully applied using our GenTrader® optimization solution to arrive at an objective value.
- Set up a one-year day-ahead study using actual, historical DA LMPs and MCPs (Market Clearing Prices for ancillary services). Plan on taking several years of data that have a broad range of price levels.
- Add to this study a price library of 5-minute real-time historical prices from the same set of days used for the historical day-ahead prices. It’s important to keep the dates aligned.
- Model your generator of interest with start-up and ramp characteristics (as they exist today) and run the studies sequentially. Let the DA study commit economically and use the realized DA commitment schedule as a basis for the RT study. For RT, set your commitment mode to allow more – but not less – commitment than the DA (the unit can capture additional price spikes but keep at least the commitment schedule as DA).
- After the RT study finishes, compile the results in Excel or a business intelligence (BI) tool to calculate DA/RT P&L for both energy and ancillary services. The final results should include both energy and ancillary services.
- Run several scenarios using faster ramp rates and compare the net profit with the base case to see the value added. Calculate Net Present Value over a time horizon that makes sense for your organization.
Impact
Based on PCI’s findings, increases in P&L due to simulating RT operations can be significant for fast-moving resources. Such increases can range from 5-30 %, which clearly demonstrates the importance of simulating both DA and RT operations when evaluating cost/benefit for performing unit upgrades.