


When it comes to reporting on RTO activity and internal operations, many utility teams are still stuck in spreadsheets, wrestling with fragmented data and delayed insights. But that’s starting to change — and fast.
In our recent webinar, three forward-thinking utilities—Cooperative Energy, NIPSCO, and the Intermountain Power Agency (IPA) — shared how they’re using PCI Insights™ to build dashboards that move faster, scale better, and deliver real-time value across trading, operations, and settlements.
Whether you’re working through Excel fatigue, struggling with data delays, or trying to democratize reporting across teams, their stories offer a real look at what’s possible when reporting tools are finally built with utility workflows in mind.
What’s driving the shift to PCI Insights?
As PCI’s Khai Le explained at the start of the webinar, PCI Insights is more than just a reporting tool — it’s a modern, cloud-first platform that helps utilities:
- Bring together data from RTO markets, ETRM workflows, and PCI apps in one unified place
- Enable both out-of-the-box and self-built reports, with full support for Power BI, Tableau, and PCI’s own visual reporting tool
- Empower business users to create reports and dashboards — without relying on IT
As Khai put it, “We’re turning the 90/10 rule upside down: less time gathering data, more time making decisions.”
What reporting innovation looks like in action
We won’t spoil all the dashboards (you’ll want to watch those for yourself), but here’s a snapshot of what each utility covered.
IPA: One source of truth for a $5B clean energy transformation
Project Manager Kyle Tran walked through how IPA, the Intermountain Power Agency, is building an end-to-end reporting system using PCI Insights — covering everything from natural gas and hydrogen operations to participant billing for 35 members. Dashboards help manage hourly energy tags, gas nominations, and operational trends — all while supporting a transition to hydrogen-powered generation.
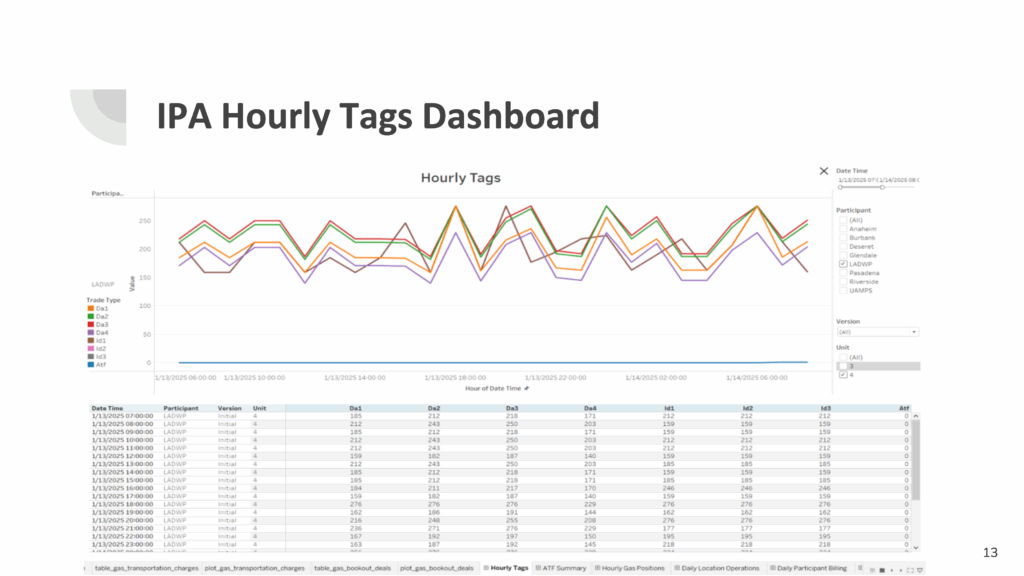
Slide from the presentation deck of Kyle Tran, project manager at LADWP, when we presented during the PCI Energy Solutions webinar “Customer Dashboards on Display: How 3 Utilities Built Winning Visualizations with PCI Insights.”
Cooperative Energy: From fragmented data to enterprise-wide insight
Power Marketing Manager Stephen Sims shared how his team transitioned from unreliable third-party vendors to a unified PCI-powered DataMart and Power BI dashboards. Now, they’re tracking generator performance, analyzing dispatch flags and regulation penalties, and using those insights to spark internal conversations that lead to real improvement.

During PCI’s recent PCI Insights webinar, Stephen Sims, power marketing manager at Cooperative Energy, showed one of the operational dashboards that helped Cooperative Energy communicate performance clearly across teams.
NIPSCO: Visual storytelling that saves hours
Christa Hook, Manager of Settlements at NIPSCO, highlighted her team’s journey from Excel to Power BI, and how PCI Insights has helped them visualize everything from day-ahead volume trends to complex RNU (Revenue Neutrality Uplift) charges. One report that used to take 8 hours to compile in Excel now takes just 45 minutes to run and verify in Power BI.

This slide from Christa Hook, manager of Market Settlements at NIPSCO, captures how data transparency is driving clarity for stakeholders. Hook presented this information in PCI’s webinar, “How 3 Utilities Built Winning Visualizations with PCI Insights.”
Want to see the dashboards for yourself?
This blog post only scratches the surface. If you’d like to dive deeper into the dashboards, hear directly from each speaker, or share the session with your team, we’re happy to send you the materials. Request access here.