











Most people in the industry remember Winter Storm Uri’s impact on the ERCOT market in February 2021: Prices stayed at the $9,000/MWh cap for much of the week, compared with a typical level near $25. Companies that had committed to serving load without owning or hedging enough generation were suddenly forced to buy at the cap to meet their obligations. Economic losses reached billions of dollars, and several companies were pushed into bankruptcy.
Some of those companies are conservative utilities with mandates to serve their customers at reasonable costs. They were planning the way most of the industry plans: a view of expected prices, a few stress cases, and a balance sheet built for a normal year. What they lacked was a clear-eyed answer to one question, asked before the storm rather than after. If the market goes to the cap and stays there, do we survive?
That is the purpose of proactive risk management. No one was expected to predict exactly what Winter Storm Uri would do to the power grid; that was never the point. The point is to understand your exposure to plausible extreme events before they happen, then decide deliberately how much risk to retain and how much to transfer. The tools are not exotic. The rest of this article walks through a practical approach, starting with the most basic question every portfolio must answer.
Stop answering the wrong question
If you run a generation portfolio, the familiar question is simple: what will it cost to serve load next year? The usual process is just as familiar: run a simulation, produce a single number, and drop it into a budget, board deck, or rate filing.
The problem is that a point forecast was never the right answer. Cost to serve is a random variable, driven by power prices, gas prices, load, and unit availability. Any one of those factors can move the result by tens of millions of dollars. When you report a single value, you are showing only one outcome from a much wider distribution, without knowing where that outcome sits. The more honest answer is the distribution itself. With that view, decisions that once depended on guesswork become clearer, including why a portfolio whose individual positions each look risky can be remarkably steady.
What a point forecast can cost you
Let’s make this concrete with a real example. We modeled a portfolio for a fictional company, RelyOn Energy: a coal unit, a combined-cycle plant, several gas units, a battery, and an obligation to serve load. Then we evaluated that same portfolio two ways for 2027.
The first approach reflects how the typical planning approach still works: Start with today’s forward prices, run the portfolio once, and report the result. That run puts the 2027 cost to serve load at $171.7 million. This is the net cost of meeting the load obligation after crediting the value earned by generation, batteries, and market sales. It is clean, defensible, and easy to put in a budget.
The second approach runs the same portfolio across many plausible versions of next year. Each run uses a different realistic path for power and gas prices, then lets the fleet operate against that path. For this study, we used 100 samples based on power and gas price risk drivers. Across those runs, the average cost is $138.1 million.
That gap reveals what a point forecast misses. The $171.7 million result is the portfolio’s intrinsic cost: its value on one fixed price path. The $138.1 million result is the expected cost across the full distribution, after the fleet adjusts to each scenario. Gas units run more when power prices are high and less when they are low; the battery charges and discharges when daily spreads justify it. The $33.6 million difference is the portfolio’s extrinsic, or option, value — the value of flexibility that a single-path run cannot capture. The units, load, and year are the same; the difference is whether the valuation lets the assets respond to the full spectrum of market conditions or only the one path in front of them.
Now stack the usual planning decisions on top of that, and the problem gets harder to ignore:
- Budgets that miss by tens of millions, then get defended after the fact instead of planned for up front
- Hedges sized to an “expected” volume that turns out to be wrong in both directions
- A maintenance outage scheduled into what quietly turns out to be the most expensive month of the year to have that unit offline
- The board asks, “what’s our exposure if gas spikes?” and the honest answer is a shrug dressed up as judgment
None of those questions is really asking for one expected number. Each of these questions is really asking how wide the range is, where the pain sits, and how likely it is to show up — and a point forecast strips all of that away.
Why ‘we already run a few scenarios’ isn’t enough
The usual response here is, “we already have stress tests.” We run a high-gas case, a low-load case, and a couple of others. That’s better than nothing, but it has three gaps that matter, and it’s worth being plain about them.
First, the scenarios carry no odds. “High gas” is a label, not a probability. You can’t take three or five hand-picked cases and turn them into a statement like “there’s a 5% chance we exceed this cost.” Math just isn’t there to do it.
Second, they move one thing at a time. Real losses don’t come from gas alone or load alone; they come from things moving together. Hot weather lifts load, suppresses wind, and pushes power prices up all at once. A one-variable-at-a-time scenario can’t produce that, so it systematically misses the critical situations that have high impact but low probability.
Third, and this is the one people miss most often: A few scenarios can’t value flexibility. A dispatchable fleet is worth more than its point forecast because it reacts to prices, running hard when power is dear and standing down when it isn’t. That reaction is the extrinsic, or option, value from earlier — the average of the fleet’s best dispatch across the whole range of prices, not a property of any single path. Evaluate a few hand-picked cases and you get a few points on a value curve that bends; the average that defines the option value simply isn’t recoverable from them. So, scenario analysis consistently misprices the very flexibility that matters most when volatility is high. Recovering the details takes many correlated paths, each with the fleet re-optimized against the prices it sees.
What the full distribution looks like
The fix is straightforward. Instead of one price path, you build many plausible ones, with power and gas moving in ways reflecting their correlation and let the portfolio operate against each. Then you look at the full distribution of outcomes.
For RelyOn Energy, that distribution tells a much richer story than the point forecast ever could:
- The center of the distribution (the median) cost to serve is about $153.1 million
- The bad-but-plausible tail, the worst 5% of outcomes, runs up to about $219.0 million
- The good tail, the best 5% of outcomes, comes in around $44.0 million
That bad tail has a name worth adopting. The P95 cost, the level you exceed only about one year in 20, is the portfolio’s Value at Risk (VaR): a single, defensible number for how bad a bad year gets at a confidence level you choose. It is the number risk managers lean on most, and it falls straight out of the distribution once you have it.
That’s a swing of roughly $175 million between a good year and a bad one, on the same portfolio. Look back at that clean point forecast of $171.7 million and notice where it lands: toward the pessimistic end of the distribution, not at its center. Budget to it and you’d be carrying a conservative number without knowing how conservative, and with no sense of how much worse a genuinely bad year could get.
Notice too that the expected cost, the $138.1 million mean, sits below the median of $153.1 million. That’s a signal, not a rounding quirk: The distribution is right-skewed, because in a handful of high-price scenarios the fleet earns so much it nearly covers the load obligation on its own, pulling the mean below the median. The shape itself tells you which way the risk leans and how far, and you only see it with the full distribution in front of you.
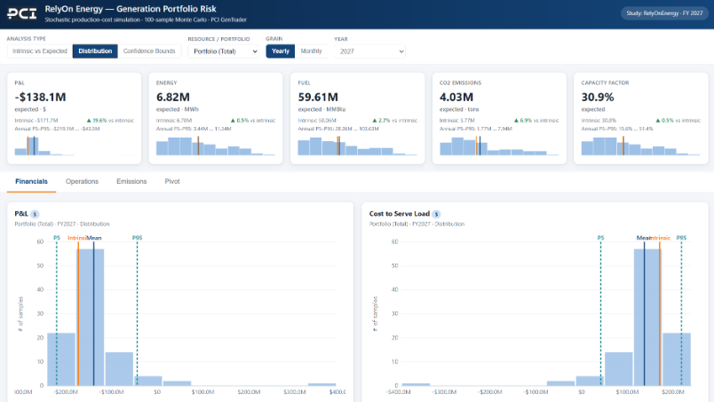
The RelyOn Energy portfolio risk dashboard in PCI GenTrader: the cost-to-serve distribution with the intrinsic run, the expected (mean), and the P5/P95 markers.
That distribution, not the point forecast, is what a board should be planning against. It lets you pick a confidence level on purpose instead of inheriting a hidden one.
Not every asset carries risk the same way
Once you have the full distribution, you can do something a point forecast simply can’t: see where the value comes from and where the risk comes from, because they are not the same thing.
Break RelyOn’s portfolio down asset by asset and the personalities show up fast:
- The combined-cycle unit is the workhorse: It carries the most value (a median around $94 million) and swings the most, because it’s the one leaning into every price move
- The gas units contribute solid, meaningful value and move with prices in a predictable way
- The coal unit has a modest median (around $31 million) but a long upside tail: In the rare high-price year it earns far more than usual
- The battery is small in dollar terms but rock-steady, doing its job in every scenario
The practical payoff: Two assets can contribute the same average value while carrying completely different amounts of risk. Once you can see that, you stop managing assets one at a time and start managing the portfolio: leaning on the steady contributors, hedging around the volatile ones, and knowing which units are quietly driving your worst-case outcomes.
Why the portfolio is far less risky than its parts
This is the most important lesson in the exercise, and the most counterintuitive.
Look at the generation fleet on its own, with the load obligation stripped away, and you are looking at a profit center with enormous variability. Its mark-to-market P&L has an expected value around $356 million, but the distribution runs from roughly $86 million in a soft-price year (P5) to $867 million (P95), with a far tail reaching about $1.5 billion. The individual units swing hard for the same reason, and the load obligation on its own swings by hundreds of millions. Manage generation as its own book and that is the swing you would have to carry and hedge against.
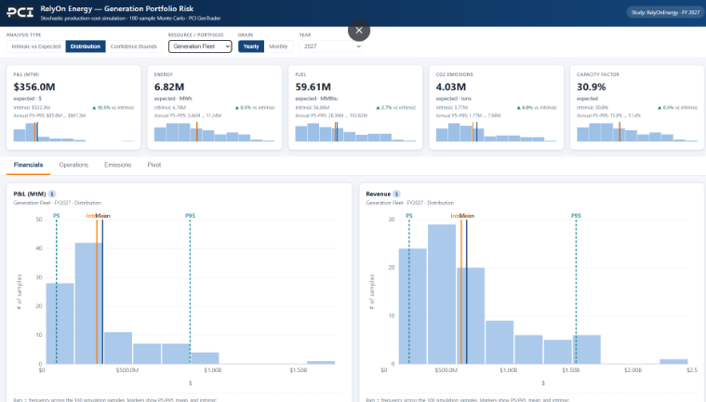
The generation fleet’s mark-to-market P&L on its own, in PCI GenTrader: an expected $356M but a distribution stretching from about $86M (P5) to $867M (P95), with a far tail near $1.5B. Netting the load obligation back in collapses this to the far narrower portfolio distribution shown earlier.
Now put the load obligation back in. The portfolio’s net cost to serve, the distribution we looked at earlier, has a P5-to-P95 spread of only about $175 million, a small fraction of what the generation fleet swings on its own. The wide generation distribution and the equally wide load distribution largely cancel.
Why? Because generation and load are natural hedges. When prices spike, serving your load gets more expensive; that’s the bad news. But those same high prices make your generators far more valuable, and that good news arrives at the same moment. When prices collapse, it works in reverse. The thing that hurts one side of your portfolio helps the other. They’re two ends of the same seesaw, and most of their individual exposure is offsetting risk.
This is exactly why a risk policy must be set on the portfolio, not on individual assets or positions. Judge the generation fleet by itself and you would size protection against a swing running toward $1.5 billion, most of which the load obligation already neutralizes. Manage the assets one at a time and you will overstate your risk and over-hedge, paying real money to cover exposure the portfolio has already closed for you.
The generating unit that looks idle, until it isn’t
There’s a subtler trap in the point forecast, and it leads to expensive operational mistakes.
At a single price forecast, some units look like they barely run. Take RelyOn’s coal unit. At the point forecast, it shows zero run hours in March and April. Flat, idle, nothing happening. The natural conclusion: Those are dead months for that unit, so that’s the obvious window to schedule a major maintenance outage. Cheap and convenient.
But that “idle” reading is an artifact of looking at exactly one price path. Run the full range and the picture changes completely: That same coal unit runs in March in 20% of scenarios and in April in 37% of them, and in the tighter, higher-priced cases it runs as much as a full month straight. Those aren’t calm months at all — they’re the months when a run of unusually hot days coincides with heavy capacity out on maintenance, sending prices spiking and leaving you desperate to have that unit available.
Schedule your outage on the point-forecast reading and you risk taking the unit down for maintenance during exactly the conditions where it’s worth the most, turning a routine operations-and-maintenance decision into a scarcity-month exposure you never intended to take. A point forecast doesn’t just hide financial risk. It hides the operating profile of any asset that happens to be “out of the money” at that one price path, and it quietly leads you toward the wrong call on when to run, when to rest, and when to take a unit offline.
Risk management is a policy, not a report
Seeing risk clearly isn’t the objective; managing it is. That means setting a risk policy: standing rules for how much risk the business will carry and where the line is it won’t cross. Start with the right frame: An energy business is a risk-taking venture, so the goal is never to eliminate risk. Hedge away all your downside and you hedge away the upside you’re in business to capture. The real objective is narrower: Make sure no plausible bad year is bad enough to threaten the business. Accept the ordinary swings; protect against the catastrophic tail.
The distribution is what lets you set that policy with numbers instead of instinct: Decide how much risk the business can absorb, and name that tolerance in dollars. Start from the loss you genuinely can’t afford — a covenant breach, or a budget blown past recovery — and make that threshold, not zero, the line you defend. From there, size hedges and procurement to pull the dangerous tail back inside what the business can survive and no further, tied to percentiles of the exposure distribution rather than a negotiated guess. Then re-run the analysis with the hedge in place and confirm the tail moved where you wanted.
But a policy is only as credible as the analysis under it. “Keep our 95% VaR inside what the balance sheet can absorb” means nothing unless you can measure that number correctly, and every practice in this blog post is what makes it measurable: a genuine distribution to read percentiles from, price paths that move together with the fleet re-optimized on each, and risk measured at the portfolio level, where generation and load cancel most of that $1.5 billion generation-fleet swing. Without those, a risk policy is just words on a page; with them, it’s a working guardrail: testable, defensible, and honest about what it does and doesn’t cover.
Getting started
You don’t need a quant desk or a research budget to begin, and most teams are already at a good starting point: You have a point forecast. Build the distribution around it. Start with the risk drivers that carry the most exposure and ignore the rest for now: power prices, gas prices, forced outages on your largest units, and renewable output if renewables are a big share of your fleet. That handful explains most of the spread you care about. Start simple and grow more sophisticated over time.
Because that’s what this is about: not chasing a more precise forecast and not engineering risk out of a business venture that takes risk by design.
Stop forecasting a single point. Start forecasting the full distribution. That’s where effective risk management begins.
This blog post walks through the numbers — our on-demand webinar walks through the tool. Watch Buck build this exact analysis live in PCI GenTrader, including the operations and emissions views not shown here, in the on-demand webinar.