

In energy trading, like most businesses, success hinges on the ability to quickly identify and correct problems so they aren’t repeated. In an ISO market with complex bidding and settlement rules, power traders often struggle to understand the financial impact of their operations in a timely manner, but due to the lag time receiving ISO settlement statements, traders often lack the data needed to assess whether they made or lost money yesterday. This is not an easy task since the required data can be voluminous and is probably spread across multiple sources.
Am I Getting the Most Out of Presettlements?
Having a presettlements system is the first step that allows you to crunch the day-after available data in order to make an educated guess of what your ISO bill is going to look like. The following information is required:
- Meter data
- Day Ahead / Real-Time (“DART”) market awards
- Dispatch instructions
- Cleared prices
Many back offices spend time each day running presettlements. But who sees the results, and how do presettlements impact operations? There needs to be an effective feedback process for presettlements to make a meaningful impact.
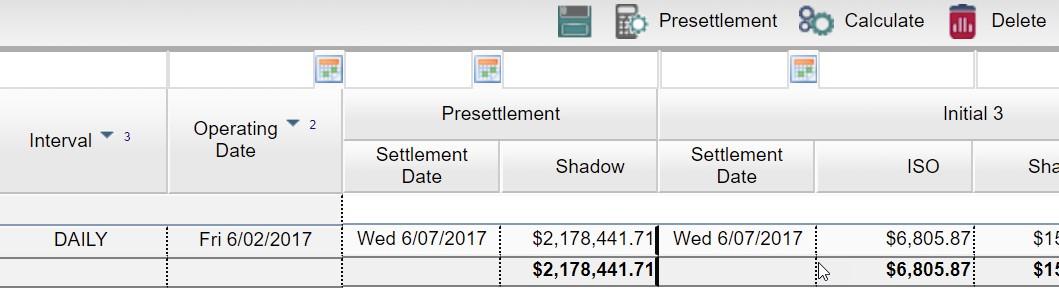
Fig. 1 – Typical presettlements results
What Are My Costs?
To know yesterday’s profits and losses (P&L), you need more than just presettlements. You also need to know your operating costs. Generation and ancillary services costs can be calculated from your unit offers and generation and ancillary service awards, but for the best insight possible, compute them at the same level of granularity as your presettlements data – even if that is at a sub-hourly level.
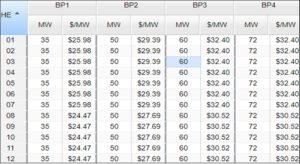
Fig 2. – Typical unit offer curve
This is where the data wrangling gets tricky. You need to combine cost and presettlements data to arrive at your P&L, and without a doubt, data warehouse (DW) and business intelligence (BI) tools can really help.
Fig 3. – BI waterfall chart for P&L visualization
Do I Have a P&L Leak?
Once you know your DART P&L (P&L considering both DA and RT markets), you need to know whether it met your day-ahead expectations. If DART P&L is lower than DA P&L (using DA costs derived from DA unit offers and market awards), then you under-performed, which PCI terms “P&L Leakage.” This is a very important and useful metric that may indicate a problem at a generation facility.
Fig. 4 – Bar chart showing units with P&L leakage or gain
What Next?
P&L leakage may be caused by operational issues such as lower-than-forecast ramping capability, dispatch center responsiveness, or fuel availability. This is where you realize the value of your analysis and take action to improve the situation. Business Intelligence solutions such as PCI’s P&L Analyzer, which is available for most ISO markets, are designed to facilitate this process.