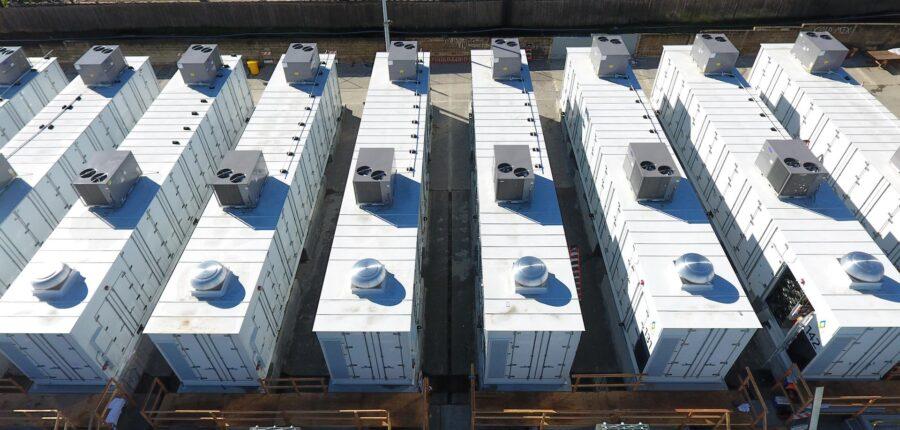
Utility-scale battery deployments are accelerating in 2018 as utilities recognize and realize the benefits of having cheap, readily available renewable energy in addition to on-demand fast ramp capability that doesn’t require the burning of fossil fuels. Until recently, having this capability was out of reach, but is quickly becoming a reality that is disrupting the industry.
Across the country, batteries are replacing fossil generators and being increasingly viewed as a demand response, as well as transmission assets to meet contingency needs. Most utility-scale batteries are Lithium-Ion, similar to – but much larger than – what we have seen in most consumer electronics. Not surprisingly, leading the way are recognizable companies such as Tesla, LG, and Samsung.
Notably, FERC issued its Order 841 in February of this year, which was crafted with the goal of removing barriers to wider wholesale market participation by energy storage assets. The expectation is that Order 841 will drive change within all ISO-controlled markets (including ISO New England, PJM, MISO, and CAISO) to reduce both energy prices, as well as the costs of energy storage. Because of FERC’s mandate, PCI is now working with several utilities, helping them model and optimize batteries to answer numerous questions, including:
- How might batteries operate in the market for resource planning?
- How can energy and ancillary service (AS) bids be made more effective?
Battery Operations
Like any generator, batteries have a maximum and minimum capacity. As an example, think of capacity as the amount of water filling a reservoir on a pumped-storage plant. Power is purchased to pump the water into the reservoir until it’s full, while spill water subsequently flows through the hydro plant to sell power until the reservoir is empty. In this example, the reservoir level is analogous to a battery’s State of Charge (SOC).
In addition to capacity, batteries have maximum and minimum hourly charge and discharge rates. Consider a battery having a maximum capacity of 40 MW and a charge/discharge rate of 10 Mw/h. This battery would be able to:
- Run full-tilt for 4 hours before it would need to recharge
- Complete recharging in roughly the same amount of time (4 hours)
It’s important to note that batteries are typically only 80-90% efficient and that they must acquire (buy) 10-20% more power than they generate.
Example: Day Ahead Planning in the California ISO Market
Batteries are very different from traditional generators in that their production costs are unknown, largely being determined by prevailing power prices. Predicting how a battery will operate tomorrow begins with forecasting those prices, as well as what the initial SOC will be at midnight. Once a price forecast for DA energy and ancillary services is established, the battery can be modeled to maximize the profits from buying low and selling high while keeping the SOC within bounds.
If the only information known is DA energy prices and SOC constraints, optimization would be complicated enough. However, there are additional factors that increase complexity and make the modeling more challenging. These include:
- Co-Optimization of Ancillary Services (AS)
- Since batteries can provide regulation and spinning reserve, a model must co-optimize energy and ancillary services.
- Batteries may provide more reg-up during energy purchase hours and more reg-down during energy sale hours. This “excess regulation” is a new dimension of co-optimization, not present with traditional generators.
- Real-Time Price Considerations
- When excess regulation is awarded due to energy purchases and sales, the unit must provide physical energy in real time since the regulation obligation is dependent on it.
- As a result, it may be advantageous for a model to maximize “DART” profits rather than simply DA profits. This involves co-optimization not only between energy and AS but also between DA and RT markets, which requires strong confidence in the price forecast fed to a very robust model.
CAISO Battery Bidding Strategies
Battery energy bid curves in CAISO include both demand and supply with the following assumptions:
- Negative bid volumes indicate a willingness to buy at the bid price;
- Positive MWs indicate a willingness to sell
Traders also submit the SOC to the ISO (to establish the initial condition for the battery), as well as bid prices for ancillary services such as regulation and spinning reserve.
By modeling the battery using an accurate price forecast, traders can formulate battery bids according to their view of the market so that DA awards are maximized (considering real-time opportunities).
Post Analysis
How well did your battery perform compared to the forecast? Well, the same optimization model can compare “actual vs. optimal” awards by taking into account actual CAISO day ahead awards and prices. Post-analysis is a critical tool that helps improve bidding strategies and price forecasts. Accuracy in forecasting is absolutely essential since, without it, no model can improve bidding strategy effectiveness.
PCI is developing a battery optimization module in our GenTrader solution that will help traders better understand how energy and ancillary price forecasts can be used to develop optimal bidding strategies. The increasing market participation of energy storage resources, along with the bidding and optimization challenges they bring, represent an exciting but complicated development for utilities. PCI’s product and market experts are ready to help your organization navigate the turbulent waters ahead.


